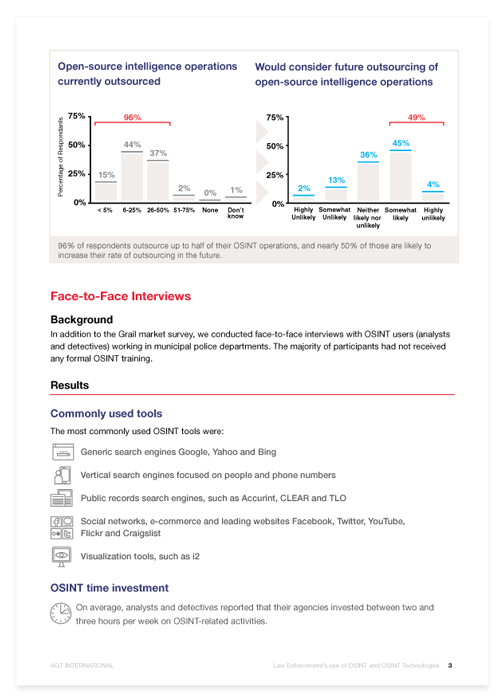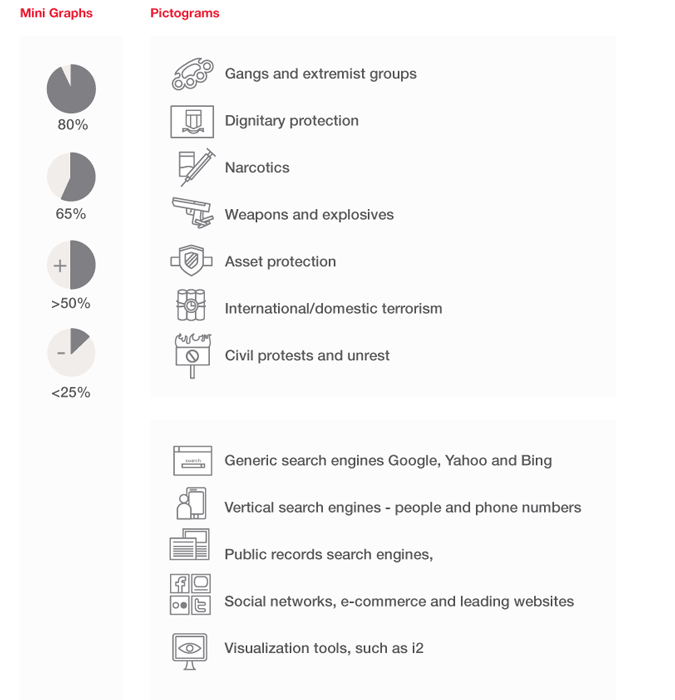


Report, chart, graph and pictogram design. Sometimes a project needs bells and whistles. This is not one of those times. The product is a simple yet unique layout for research paper presentations. Includes system of graphs, charts and pictograms to illustrate data.
Art Direction
Page Layout
Icon Development
📝

